Patent Stats from the Intellectual Property Office
The Intellectual Property Office or IPO (formerly the UK Patent Office), occasionally releases patent stats and reports that contain a wealth of information on patent applications received by, and patents granted by their offices. In the infographic below, we have attempted to visually represent some of the most interesting data points we uncovered in the latest reporting data available from the Intellectual Property Office (view their full report online at https://www.gov.uk/government/uploads/system/uploads/attachment_data/file/318346/Facts_and_Figures.pdf).
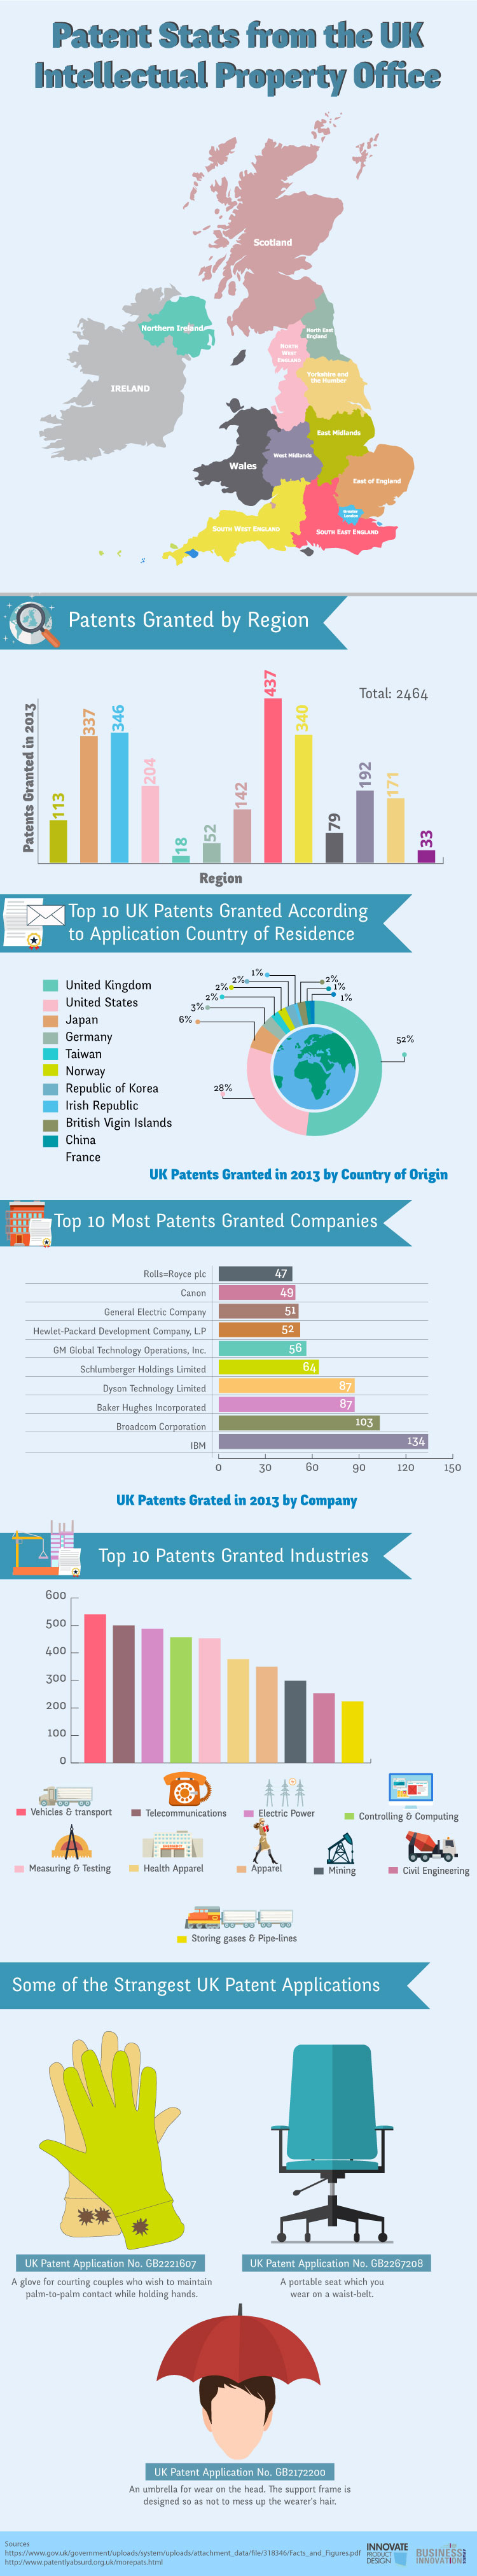
Some of the interesting facts you'll find below:
- South-East England is the most prolific region when it comes to the number of patents being granted according to the most recent data. Greater London, East of England, and South-West England were tightly bunched as the second, third, and fourth busiest regions for receiving patent grants.
- The United States and Japan were the recipients of the highest number of IPO patents (excluding the UK) as measured by the country of origin from where the patent application was submitted.
- IBM & Broadcom have been granted more patents by the UK Intellectual Property Office than any other companies
- Vehicles and Transportation are the industry for which the most patents were granted during the most recent data period, followed by Telecommunications.
Lastly, as a follow up to some of our recent posts on the many ridiculous patents that have been applied for or granted over the years (ex: https://www.innovate-design.co.uk/ridiculous-patent-dog-grooming-salon-chair/), we end the graphic with some of the most notable goofy patents compiled by the team at Patently Absurd.
Feel free to share this infographic on social media, post it on your own site using the embed code below the graphic, or tell us your thoughts on it by submitting a comment at the bottom of the page!
Patent Stats Infographic:
[supsystic-social-sharing id='2']